The framework that separates how well an observer can distinguish signal from noise from how willing that observer is to say the signal is present. It replaced the idea of a fixed sensory threshold, and it supplies the standard way of evaluating any yes-or-no decision made under uncertainty.

Consider an operator watching a radar screen for aircraft. Sometimes an aircraft is present and sometimes the screen shows only noise, and the operator must say which.
Four outcomes are possible: a hit when a present signal is reported, a miss when it is not, a false alarm when a signal is reported and none was present, and a correct rejection.
The problem is that the hit rate alone is uninformative. An operator who reports an aircraft every time achieves a perfect hit rate and is useless. A cautious operator has few false alarms and misses real targets. These two differ in decision policy, not necessarily in perceptual ability, and any measure that cannot tell them apart is measuring the wrong thing.
The theory, developed in the early 1950s by Wilson Tanner, John Swets and David Green out of wartime radar work and statistical decision theory, makes one structural assumption.
On any trial the observer receives a single continuous quantity of evidence. On noise-only trials that quantity varies randomly around some level; when a signal is present it varies around a higher level. The two distributions overlap, and the observer sets a criterion, reporting a signal when the evidence exceeds it.
Two independent parameters follow, and separating them is the theory's contribution.
Sensitivity, written d prime, is the distance between the means of the two distributions in units of their standard deviation. It measures how discriminable the signal is and is unaffected by where the criterion sits.
Criterion, or bias, is where the observer places the cutoff. It shifts with the costs of the two error types and with the expected frequency of signals, and it changes hit and false alarm rates together without changing sensitivity.
Both are computed from the hit and false alarm rates, which is why the theory requires that both be recorded. An experiment that reports only accuracy on signal trials cannot recover either.
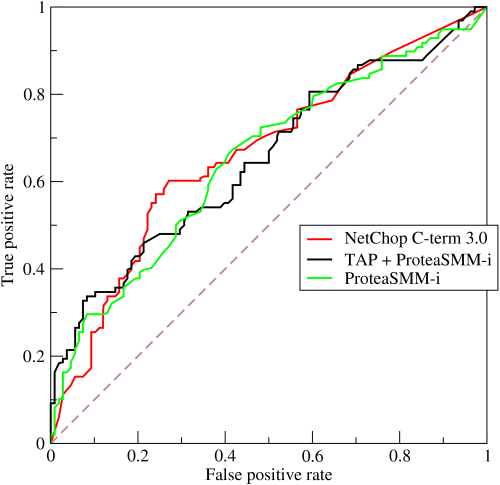
Plotting hit rate against false alarm rate as the criterion is varied traces the receiver operating characteristic, a name inherited directly from the radar receivers the method was built for.
Moving the criterion moves the observer along one curve. Changing sensitivity moves to a different curve. The diagonal represents no discrimination, and the area under the curve is a measure of sensitivity that does not depend on the criterion or on assuming the distributions are normal.
The empirical result that displaced the older account is that these curves are smooth and continuous. A true sensory threshold, below which nothing is detected, predicts a different shape. Detection behaves as a decision about noisy continuous evidence rather than as the crossing of a fixed boundary, and this is why the concept of an absolute threshold was replaced by a criterion-dependent one.
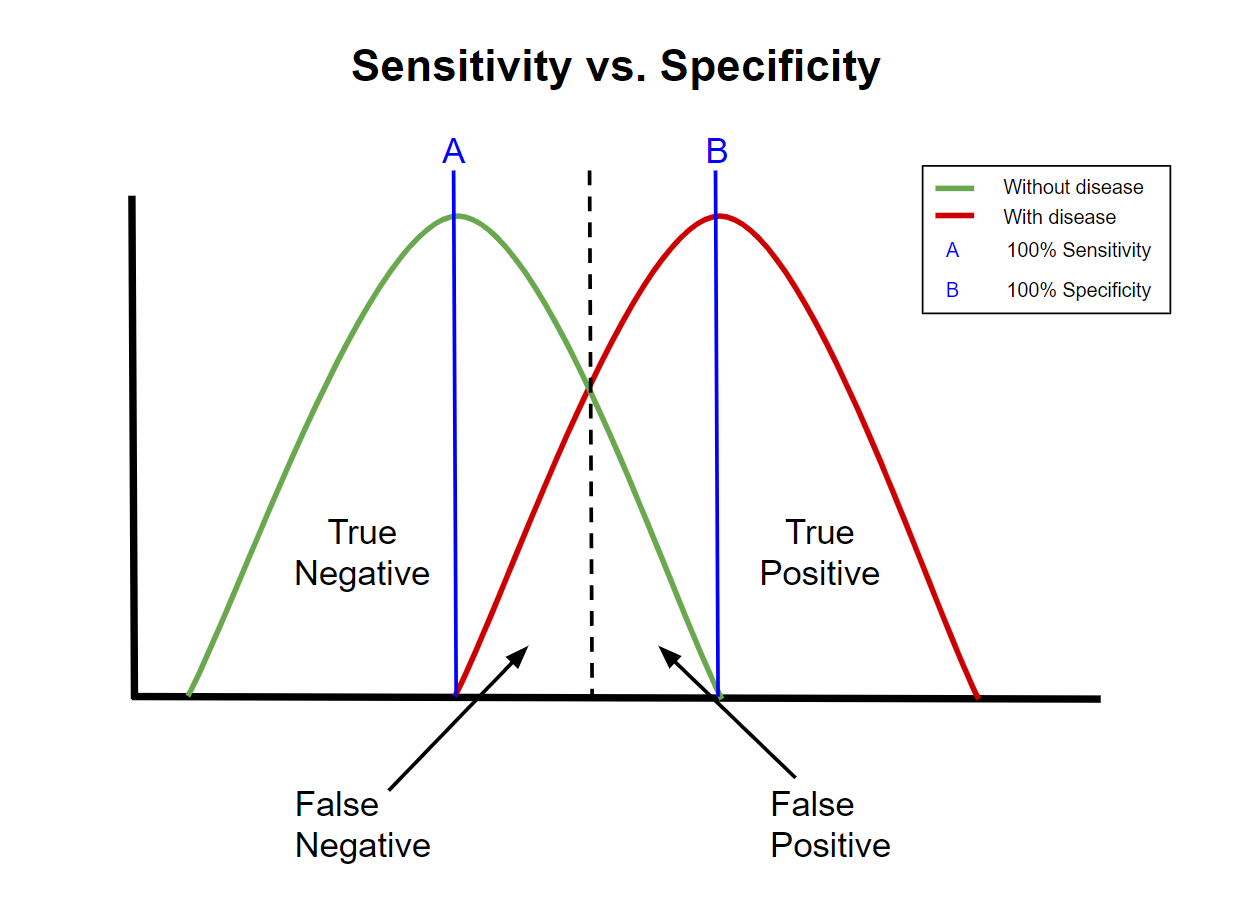
Medical diagnosis uses the framework under different names. Sensitivity is the hit rate and specificity is one minus the false alarm rate, and ROC analysis is standard for evaluating diagnostic tests and for choosing cutoffs. The choice of cutoff is explicitly a value judgement about the relative cost of missing a disease against the cost of a false positive, which the framework makes explicit rather than hiding inside a single accuracy number.
Recognition memory is analysed the same way. Saying an item was seen before is a decision on continuous evidence of familiarity, and the theory separates how well someone remembers from how readily they say yes.
Eyewitness identification research uses it to compare lineup procedures, and it has changed recommended practice by showing that some procedures previously judged superior were only inducing more conservative responding.
Machine learning evaluation adopted ROC curves and the area under them wholesale, and they are now among the most reported metrics for classifiers, particularly where classes are imbalanced and raw accuracy is misleading.
The standard model assumes both distributions are normal with equal variance, and empirical ROC curves are often asymmetric in a way that indicates unequal variance. This is usually handled by fitting the unequal-variance model, at the cost of a second parameter.
Whether the underlying evidence is genuinely continuous, or whether some tasks involve a discrete high-threshold process, has been argued for decades, particularly in recognition memory, where dual-process accounts propose that recollection and familiarity contribute differently. The evidence favours continuous models for most tasks and the dispute is not fully closed.
The framework also says nothing about where the evidence comes from. It is a measurement model, not a mechanism, and treating d prime as though it explained perception rather than quantified it is a common misuse.
Signal detection theory established that performance and bias are separable and must be measured separately, a point that applies far beyond perception. Any procedure that produces a yes or no answer from ambiguous evidence, whether a radiologist, a screening test, a spam filter or a jury, has both a discriminability and a threshold, and confusing them produces bad evaluations and worse policy.