Climate sensitivity is the amount of warming that follows from doubling the concentration of carbon dioxide in the atmosphere. It is the single number that most determines how bad climate change gets, and after more than a century of work its value is still given as a range rather than a figure.
That carbon dioxide traps outgoing infrared radiation is nineteenth-century physics, measured in the laboratory and not disputed by anyone working in the field. That the planet has warmed and that human emissions are the principal cause is likewise established, and it is covered in the climate change capsule.
Sensitivity is a different question, and confusing the two is the most common error in public argument about this subject. Uncertainty about how much warming a doubling produces is not doubt about whether warming is happening or what is causing it.
The direct effect of doubling carbon dioxide is straightforward to calculate and comes to roughly one degree Celsius. Almost everything difficult is in the feedbacks that follow.
Water vapour is the largest and is well understood: warmer air holds more of it, and water vapour is itself a greenhouse gas, so the effect roughly doubles the direct warming. Ice albedo is also reasonably well constrained: melting ice exposes darker surfaces that absorb more sunlight.
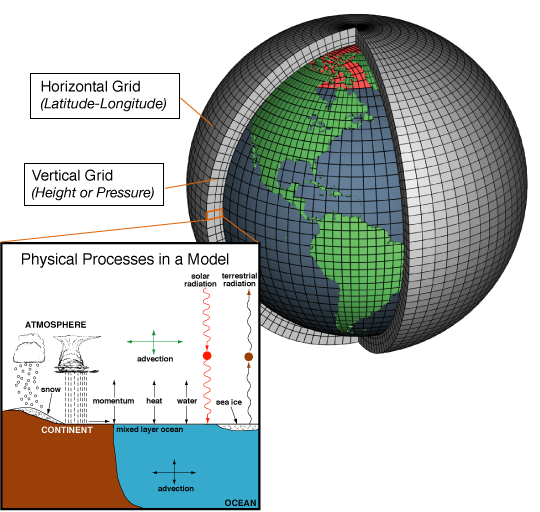
Clouds are the problem. They both reflect incoming sunlight, which cools, and trap outgoing heat, which warms, and which effect dominates depends on cloud height, thickness, droplet size, and location. Low marine cloud in particular sits below the resolution of global models and has to be approximated, and that approximation is the largest single source of the spread.
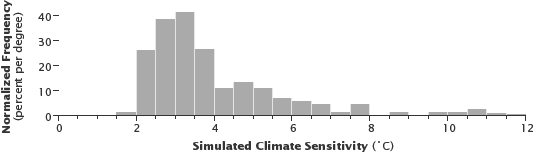
The 1979 Charney report gave 1.5 to 4.5 degrees, and that range survived essentially unchanged for nearly forty years, which was itself a source of frustration. The 2021 IPCC assessment narrowed it, giving a likely range of 2.5 to 4 degrees with a best estimate of 3, by combining three independent lines of evidence rather than relying on models alone: the physics of the feedbacks, the historical temperature record, and palaeoclimate evidence from past warm periods.
That narrowing is a genuine advance and it cuts both ways. It made very low sensitivity, below about 2 degrees, difficult to sustain, and it also made the most alarming high-end values less likely than some models had suggested.
Several remain open. A subset of the latest generation of models runs notably hotter than the assessed range, and whether that reflects better cloud physics or a flaw in it is actively argued; the IPCC chose not to weight models equally for this reason. Whether sensitivity is itself constant, or rises as the planet warms and cloud regimes shift, is unresolved. And estimates derived from the historical record tend to come out lower than those from models, a discrepancy attributed variously to aerosol cooling being poorly quantified, to the pattern of ocean warming, and to the record being too short.
None of this is a reason for complacency, and the asymmetry matters: the consequences of sensitivity being at the high end are far worse than the benefits of it being at the low end, which is why the uncertainty is generally treated as a reason for caution rather than for delay.