Simpson's paradox is the phenomenon in which a trend appears in several groups of data and reverses when the groups are combined. It is not a curiosity or a trick of presentation. It is an arithmetic certainty under certain conditions, and it means that no dataset can be interpreted without knowing how it was assembled.
The reversal happens when group sizes differ and the grouping variable is associated with both the treatment and the outcome. Averaging across unequal groups weights them unequally, so the aggregate can point the opposite way to every part of it. There is nothing paradoxical about the mathematics; the paradox is entirely in the expectation that an aggregate must resemble its parts.
The best known example is the 1973 graduate admissions data at the University of California, Berkeley. Overall, men were admitted at a notably higher rate than women, which looked like clear evidence of bias. Examined department by department, most departments admitted women at a slightly higher rate than men.
The explanation was that women applied disproportionately to departments with low admission rates, and men to departments with high ones. The aggregate reflected which departments people applied to, not how applicants were treated within them.

That case is often told as though it resolved the question of bias, and it did not. It relocated it. If departments women applied to were underfunded and therefore admitted fewer students, that is a question about the institution rather than about individual admissions committees, and the data cannot settle which reading is right.
The paradox appears wherever aggregated data is used to make decisions. A treatment can appear better than another overall while being worse for every patient subgroup. A country's death rate from a disease can exceed another's while being lower in every age band, purely because the populations have different age structures, which is why crude rates are age-standardised before comparison. A batter can have a higher average than a rival in each of two seasons and a lower average across both.
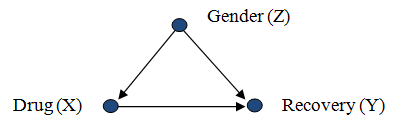
The critical point, made forcefully by Judea Pearl, is that statistics alone cannot say which analysis is correct. Whether to look at the aggregate or the subgroups depends on the causal structure behind the data, and that structure is not contained in the data.
If a variable is a confounder, one that affects both the treatment and the outcome, the analysis should adjust for it. If it is a mediator, sitting on the causal path between them, adjusting for it removes part of the effect being measured and gives the wrong answer. The two cases can produce identical numbers. Choosing correctly requires knowledge about the world that no amount of additional data supplies, which is the strongest available argument that causal reasoning is a separate discipline from statistical description.